🚀 A Community Nodes Project

The Premier DEX Analytics Platform for Klever Chain

Track tokens, analyze trades, monitor your portfolio, and stay ahead of the market with real-time data and powerful tools built by the community, for the community.

45+
Tracked Tokens
$130K+
Total Liquidity
3
DEX Exchanges
24/7
Real-time Updates

Comprehensive Trading Tools

Everything you need to make informed trading decisions on Klever Chain DEXes

📈

Real-time Price Tracking

Monitor live prices, 24h changes, volume, and market cap across all tokens with automatic 30-second refresh intervals.

📊

Advanced Charts

TradingView-powered candlestick charts with multiple timeframes (30m, 1h, 4h, 1d) and drawing tools for technical analysis.

💼

Portfolio Tracker

Connect your Klever wallet to track holdings, monitor P&L, view cost basis, and analyze portfolio performance over time.

🔄

Cross-DEX Arbitrage

Discover arbitrage opportunities between Swopus and Digiko DEX with slippage calculations and trade simulation.

📉

Platform Statistics

Track ecosystem-wide metrics including daily volume, trade counts, unique wallets, and bot activity detection.

🆕

New Pairs Discovery

Stay ahead by discovering newly listed trading pairs as soon as they appear on supported exchanges.

Powerful Platform

A comprehensive suite of tools designed for Klever Chain traders

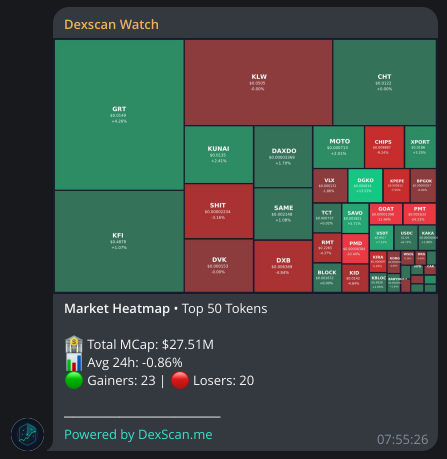
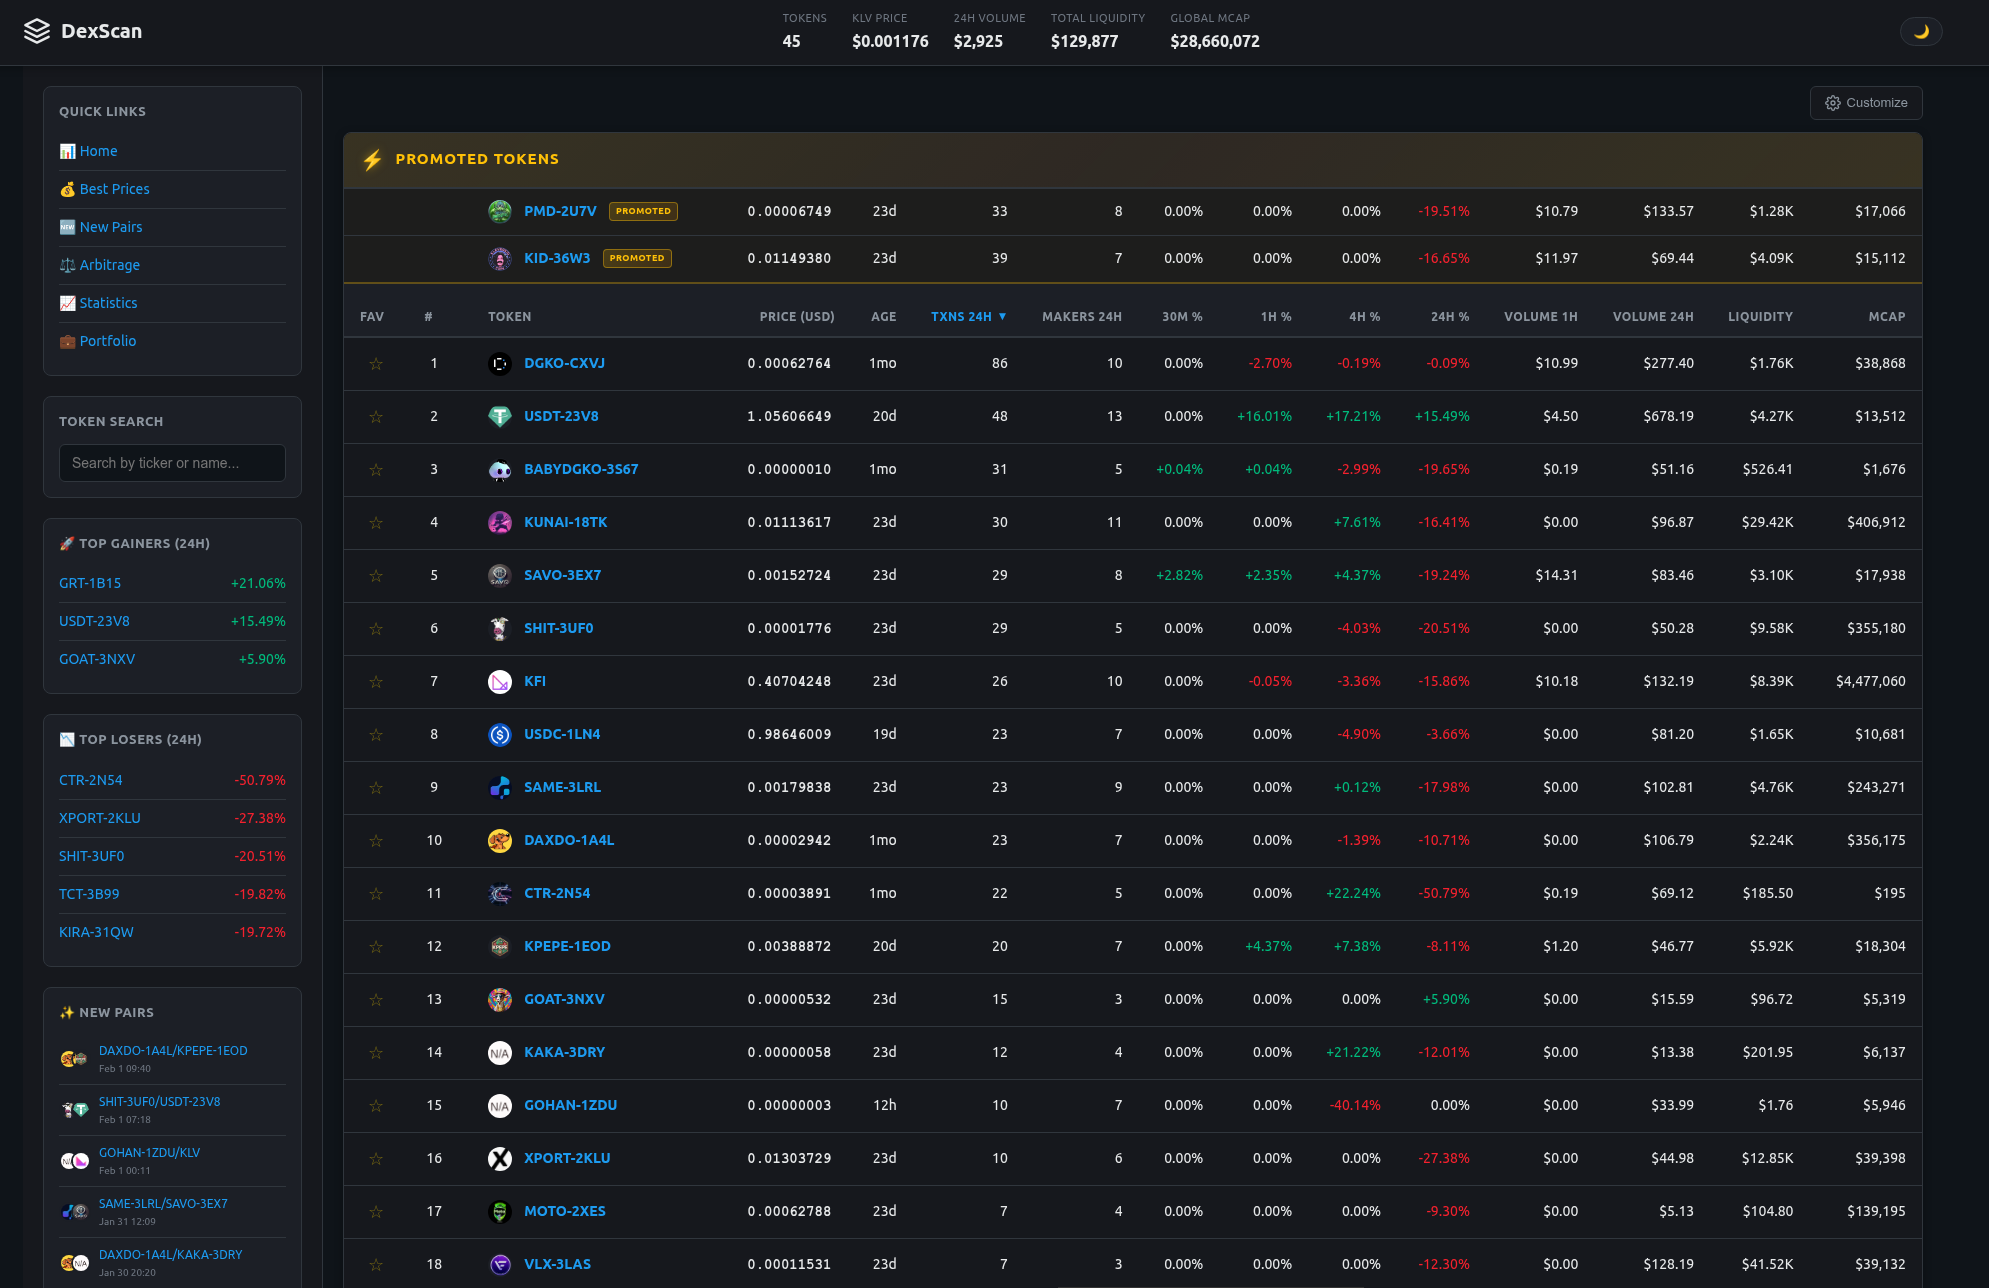
Token Listings Dashboard

Your central hub for monitoring the entire Klever Chain token ecosystem at a glance.

  • Sortable table with price, volume, liquidity, and market cap
  • Multi-timeframe price changes (30m, 1h, 4h, 24h)
  • Token age tracking from first discovery
  • Top gainers, losers, and new pairs sidebar
  • Customizable column visibility and ordering
  • Promoted tokens section for featured projects
DexScan Main Dashboard

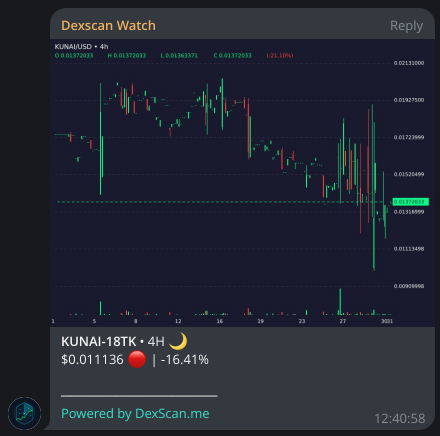
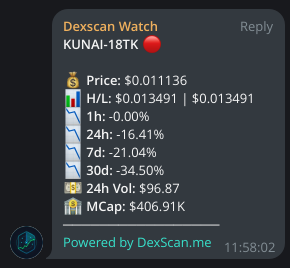
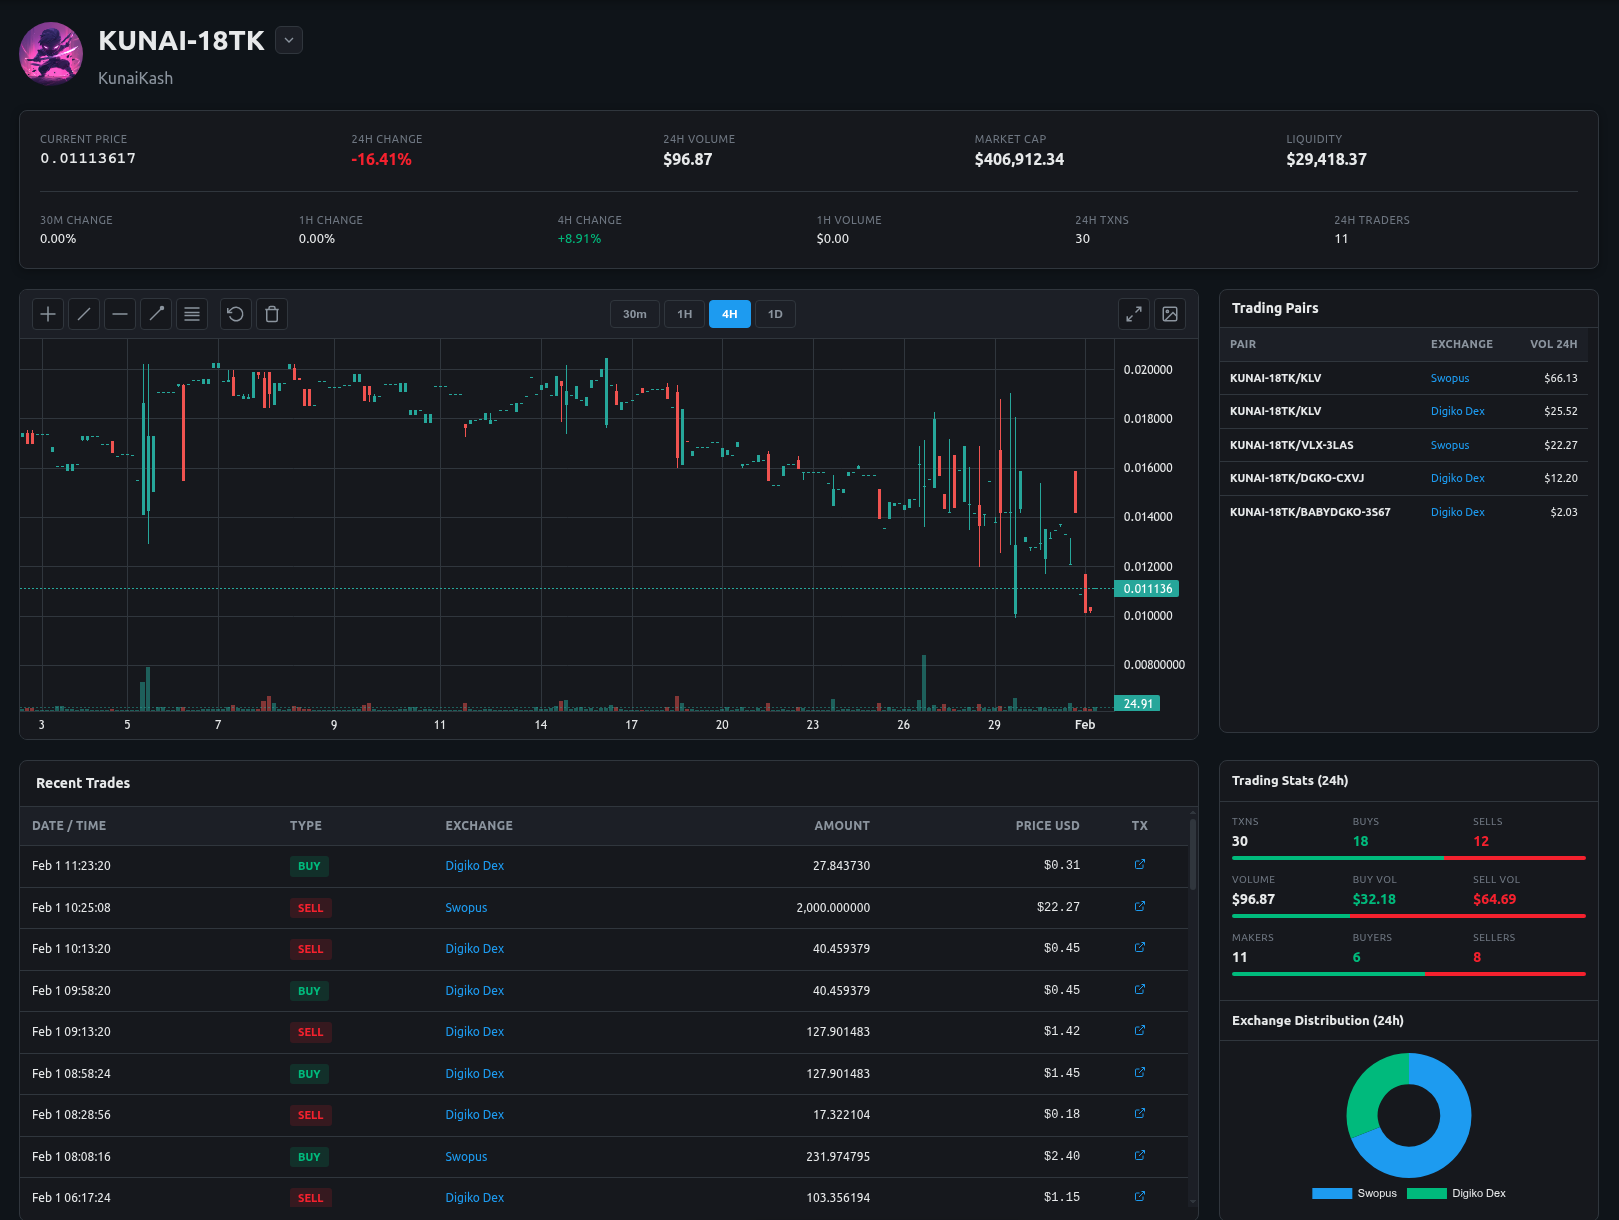
Interactive Token Charts

Deep dive into any token with professional-grade charting and trading data.

  • TradingView candlestick charts with drawing tools
  • Multiple timeframes: 30m, 1h, 4h, 1d
  • Real-time trade feed showing all transactions
  • Trading stats: buys, sells, volume breakdown
  • Exchange distribution visualization
  • Active traders leaderboard
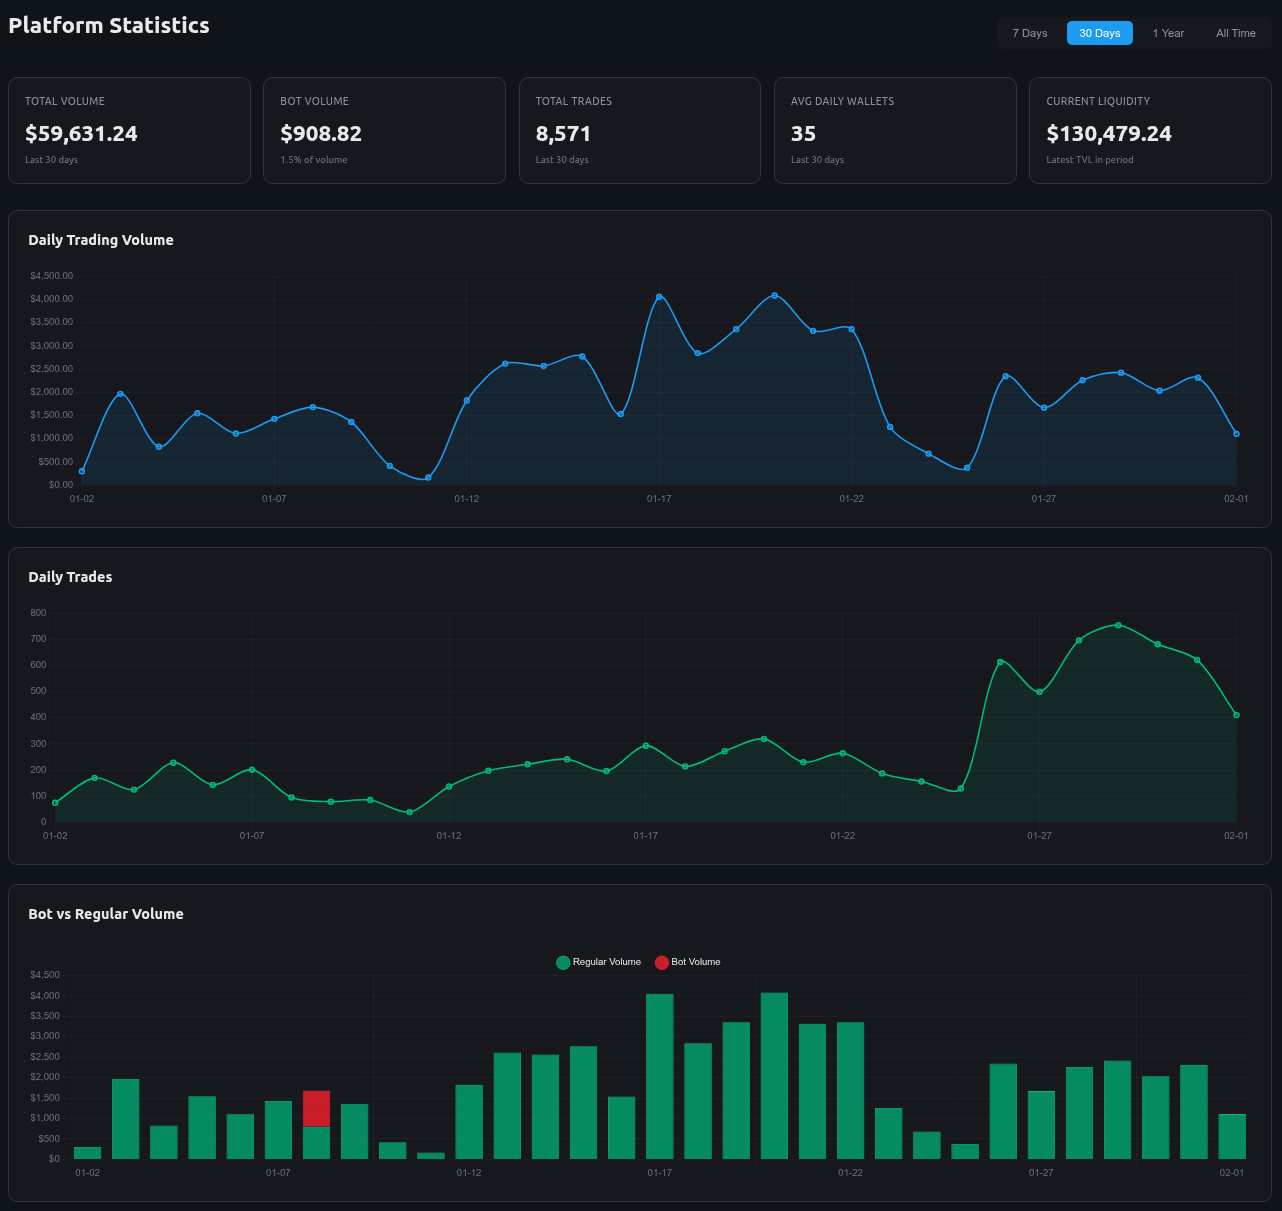
Token Chart View

Platform Analytics

Understand market trends with comprehensive ecosystem-wide statistics.

  • Daily trading volume and trade count charts
  • Unique wallet activity tracking
  • Bot vs regular trading volume analysis
  • Historical liquidity (TVL) trends
  • Exchange volume distribution
  • Flexible period selection: 7D, 30D, 1Y, All Time
Platform Statistics

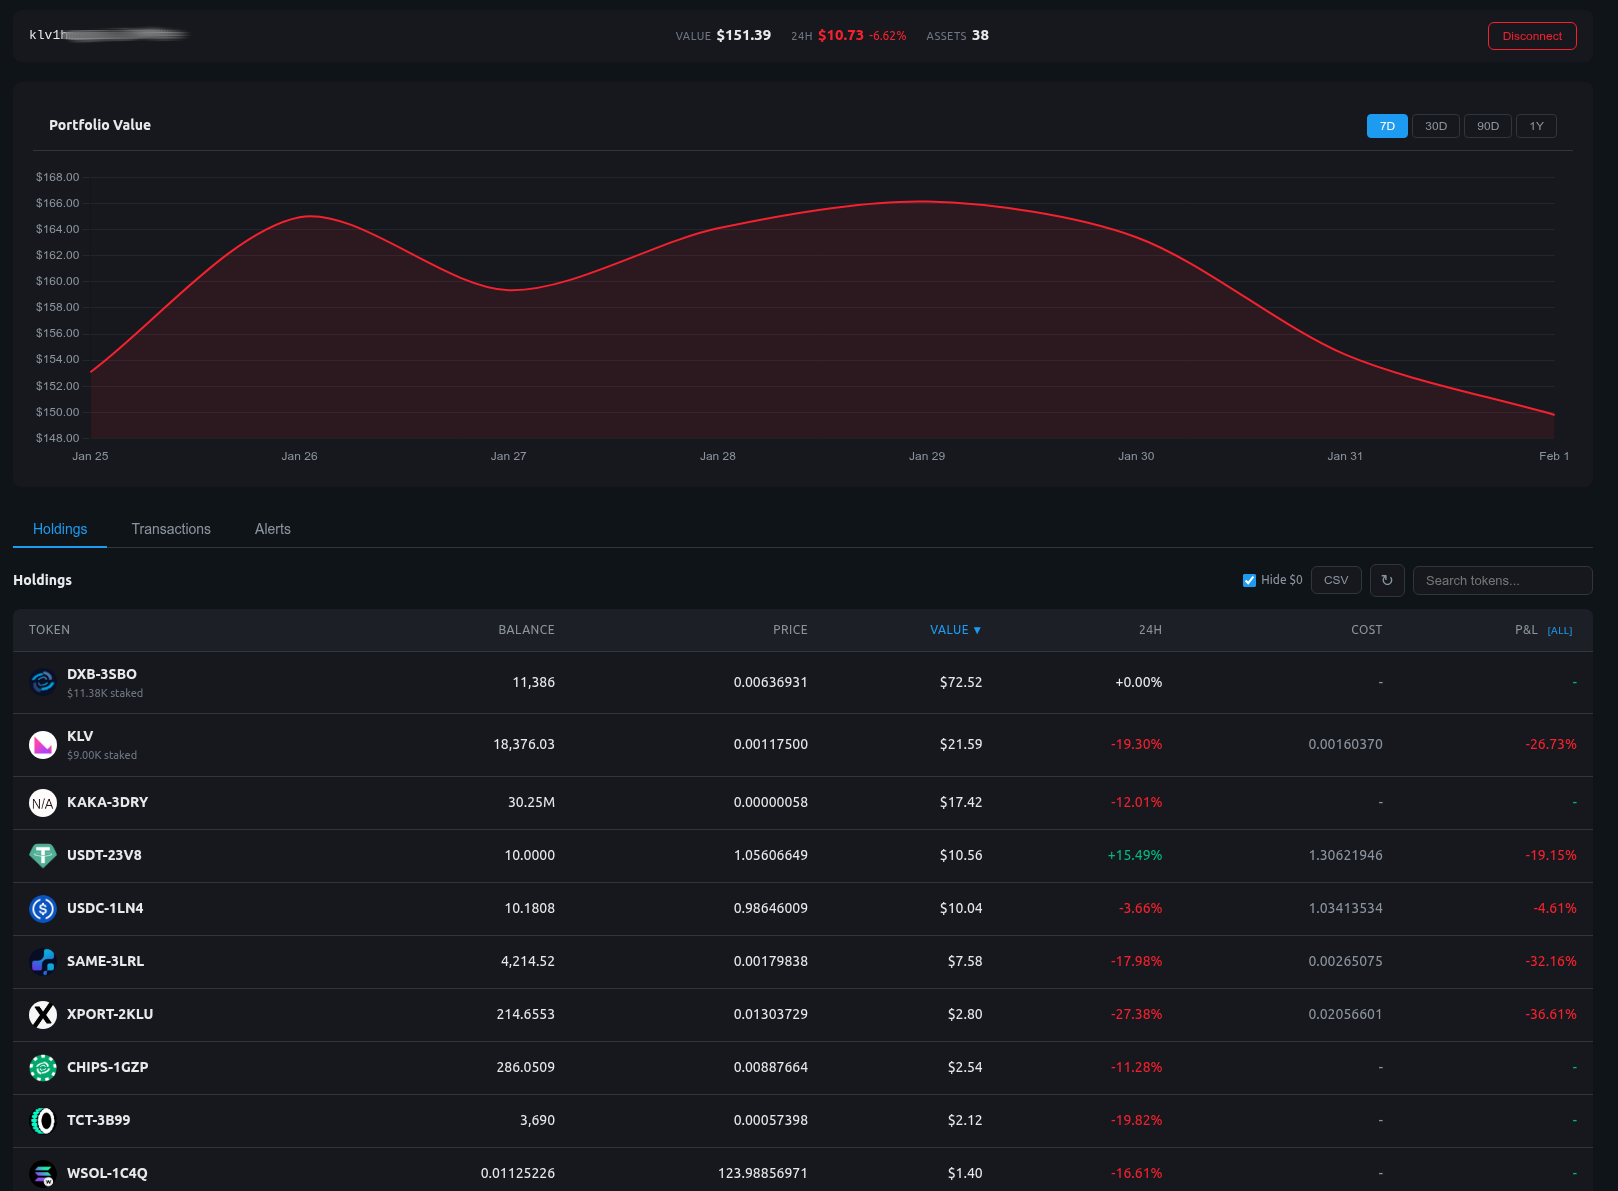
Portfolio Management

Connect your wallet and track your holdings with detailed performance metrics.

  • Klever wallet integration with secure signature auth
  • Track up to 10 wallets per account
  • Portfolio value chart with historical tracking
  • Holdings table with balance, price, and value
  • Cost basis tracking and P&L calculations
  • 24h and all-time performance views
Portfolio Tracker

🤖 Telegram Bot

Bring DexScan data directly to your Telegram groups and channels

Market Heatmap

Market Heatmap

Visual overview of top 50 tokens by market cap with color-coded 24h performance

Candlestick Chart

Candlestick Charts

Full candlestick charts with multiple timeframes and theme options

Price Card

Price Cards

Detailed price info with 1h, 24h, 7d, 30d changes and key metrics

Bot Commands

/p TOKEN Get price details with multi-timeframe changes
/ch TOKEN Display candlestick chart (supports timeframes)
/hmap Generate market heatmap of top tokens
/alert TOKEN <above|below> PRICE Set price alerts for tokens
/settings theme Toggle dark/light chart theme
/settings cleanup Auto-delete bot messages (admins)
🤖 Add Bot to Your Group

Join the Community

Stay updated, share feedback, and connect with fellow Klever Chain traders